Application of Molecular Interaction Technology in the Research SPR and BLI in the Development of Biopharmaceuticals
Surface plasmon resonance (SPR) and Bio-Layer Interferometry (BLI) are two common technology platforms utilizing the biosensors [2]. Both can be used to characterize the binding specificity, affinity, and kinetics between the tested molecules in real time. Although SPR remains as the gold standard in the pharmaceutical industry, BLI has become more popular in recent years because it’s relatively easy to use. Both technologies will provide a comprehensive dataset including binding affinity (KD), binding rate (ka), and dissociation rate (kd) etc between the molecules. The type of compatible molecules/compounds can include polypeptides, proteins, oligonucleotides, oligosaccharides, lipoids, phages, viruses and cells, etc.
The basic setup of SPR and BLI are similar. The protein of interest is first immobilized on the surface of the biosensor, which is often coated with antibodies or compound that can selectively capture the protein. For example, streptavidin (SA)-coated chips are used for biotinylated protein, while NTA-coated biosensors are suitable to capture his-tagged protein. Following the immobilization, the ligand (immobilized protein) will be exposed to a solution containing the analyte. The binding of the analytes and the immobilized ligands result in the change of thickness on the biosensor, resulting in the changes in the index of refraction. The repeated binding and dissociation cycles with analytes of different concentrations can provide definitive quantification of binding affinity between the analyte and the ligand.
Sino Biological offers customized affinity characterization, including both Biacore analysis (Biacore T200), and Octet analysis (Octet RED). We have used these technologies for a variety of applications including antibody screening, activity testing, epitope mapping, consistency evaluation, and quality control testing. The following section includes a series of internal case studies.
I. Antibody-producing cell line screening
Biacore and Octet can be used to simultaneously evaluate the expression yield of the tested cell lines, and the binding kinetics of the antibodies produced from the same cell line.
The two experiments below were an example of using SPR and BLI to identify the candidate antibodies with the desired binding affinity and high expression yield.
The following Biacore experiments screened 3 cell supernatants against the target 2019-nCoV Spike RBD, with the goal of obtaining a cell line with high expression and high affinity antibodies to the target. From the following screening data, cell line 127 meets the requirements.
In the following Octet experiment, 8 cell supernatants against the target NP-2019-nCoV were screened. The purpose is to obtain a cell line that can express high-affinity antibodies to the target. Judging from the following screening data, 14G9 and the reference 40143-MM08 cell line meet the requirements.
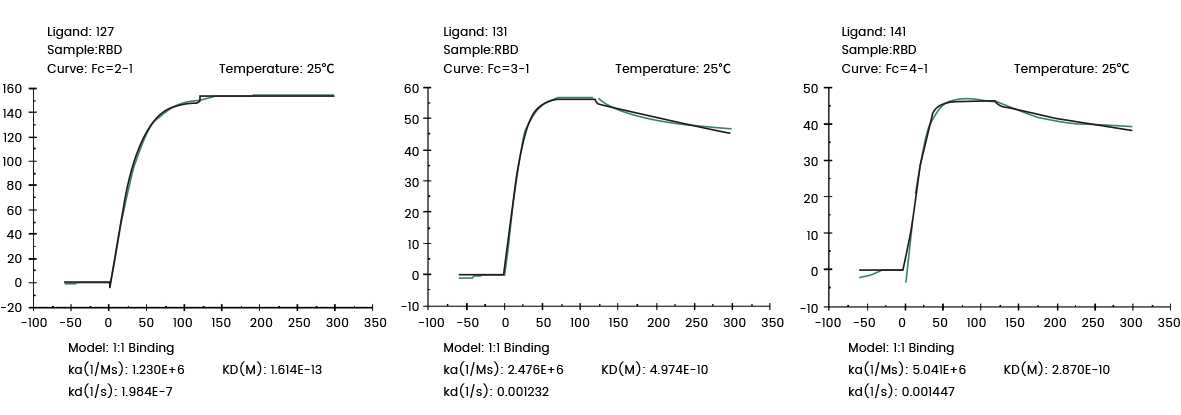
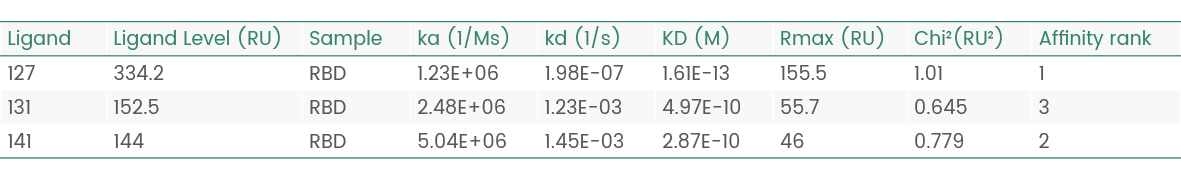
Figure 1 Screening of cell supernatant against target protein RBD (Biacore data)
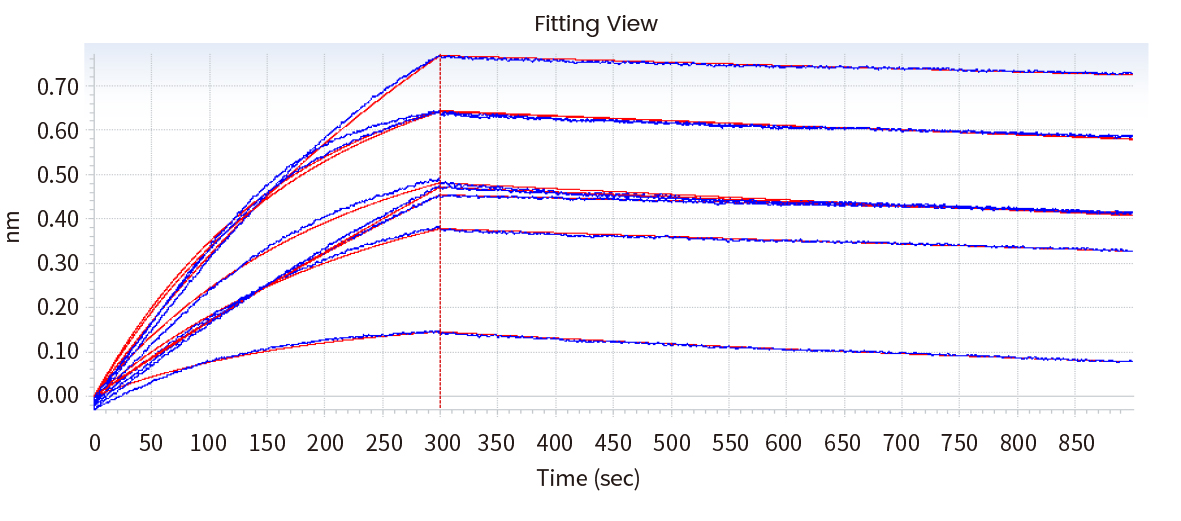
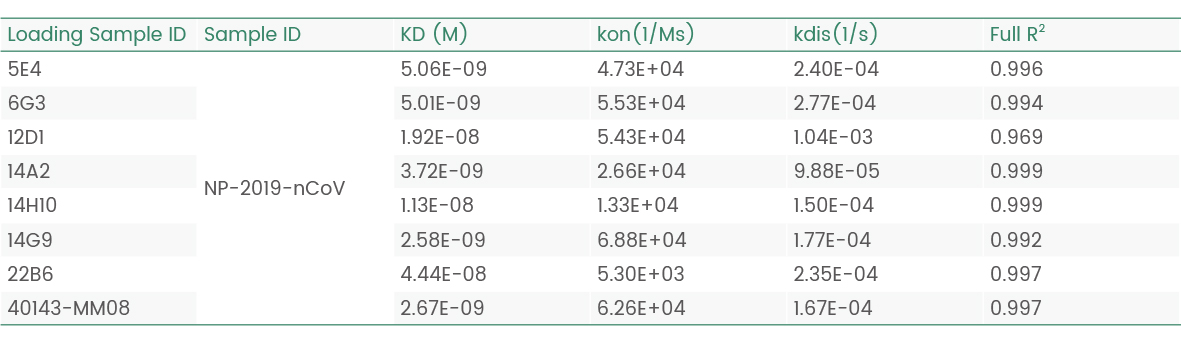
Figure 2 Screening of cell supernatant against target protein NP (Octet data)
II. Kinetic screening of candidate antibodies
A kinetic test was performed to evaluate a pool of antibody drug candidates as shown below:
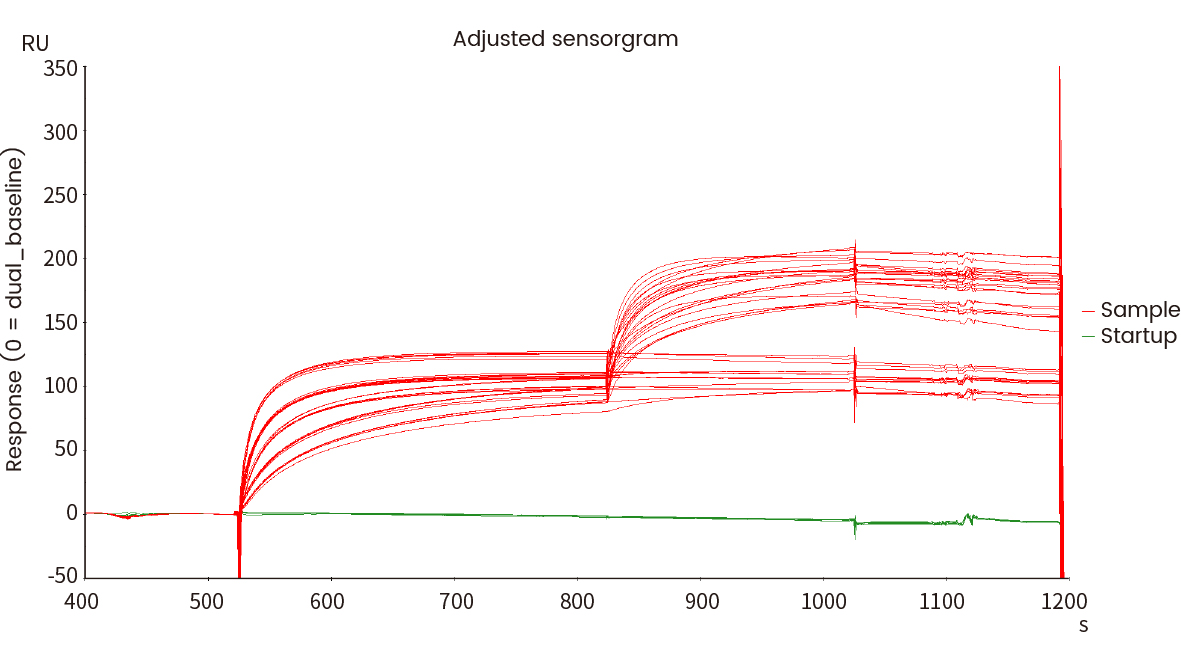
The following Biacore experiment screened 8 cell supernatants against the target P protein in order to obtain antibody cell lines that have high-affinity with the target and are difficult to be dissociated. From the following screening data, cell line No. 2 meets the requirements.
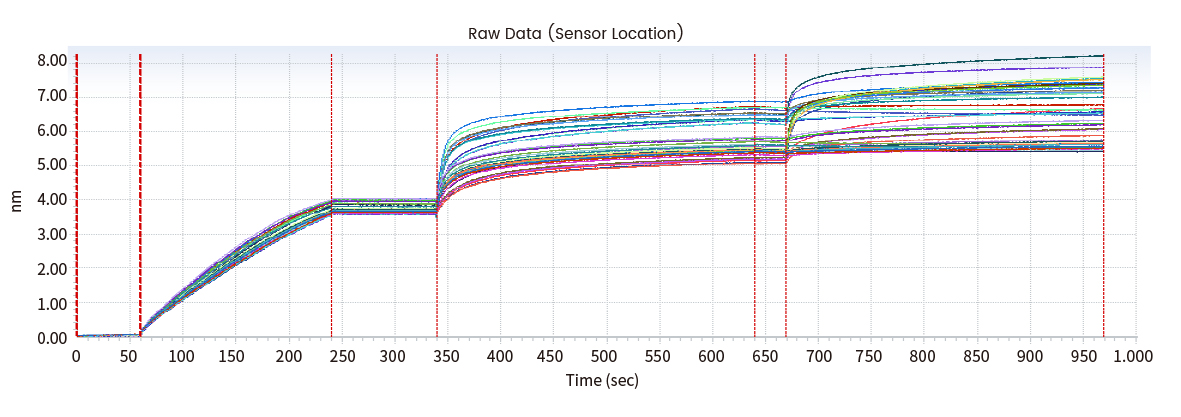
In the following Octet experiment, 6 cell supernatants against the target G protein were screened in order to obtain cell lines that have high-affinity with the target and are easier to be dissociated. From the following screening data, the No. 4 cell line meets the requirements.

Figure 3 Kinetic screening of candidate molecules against the targets (Biacore data)
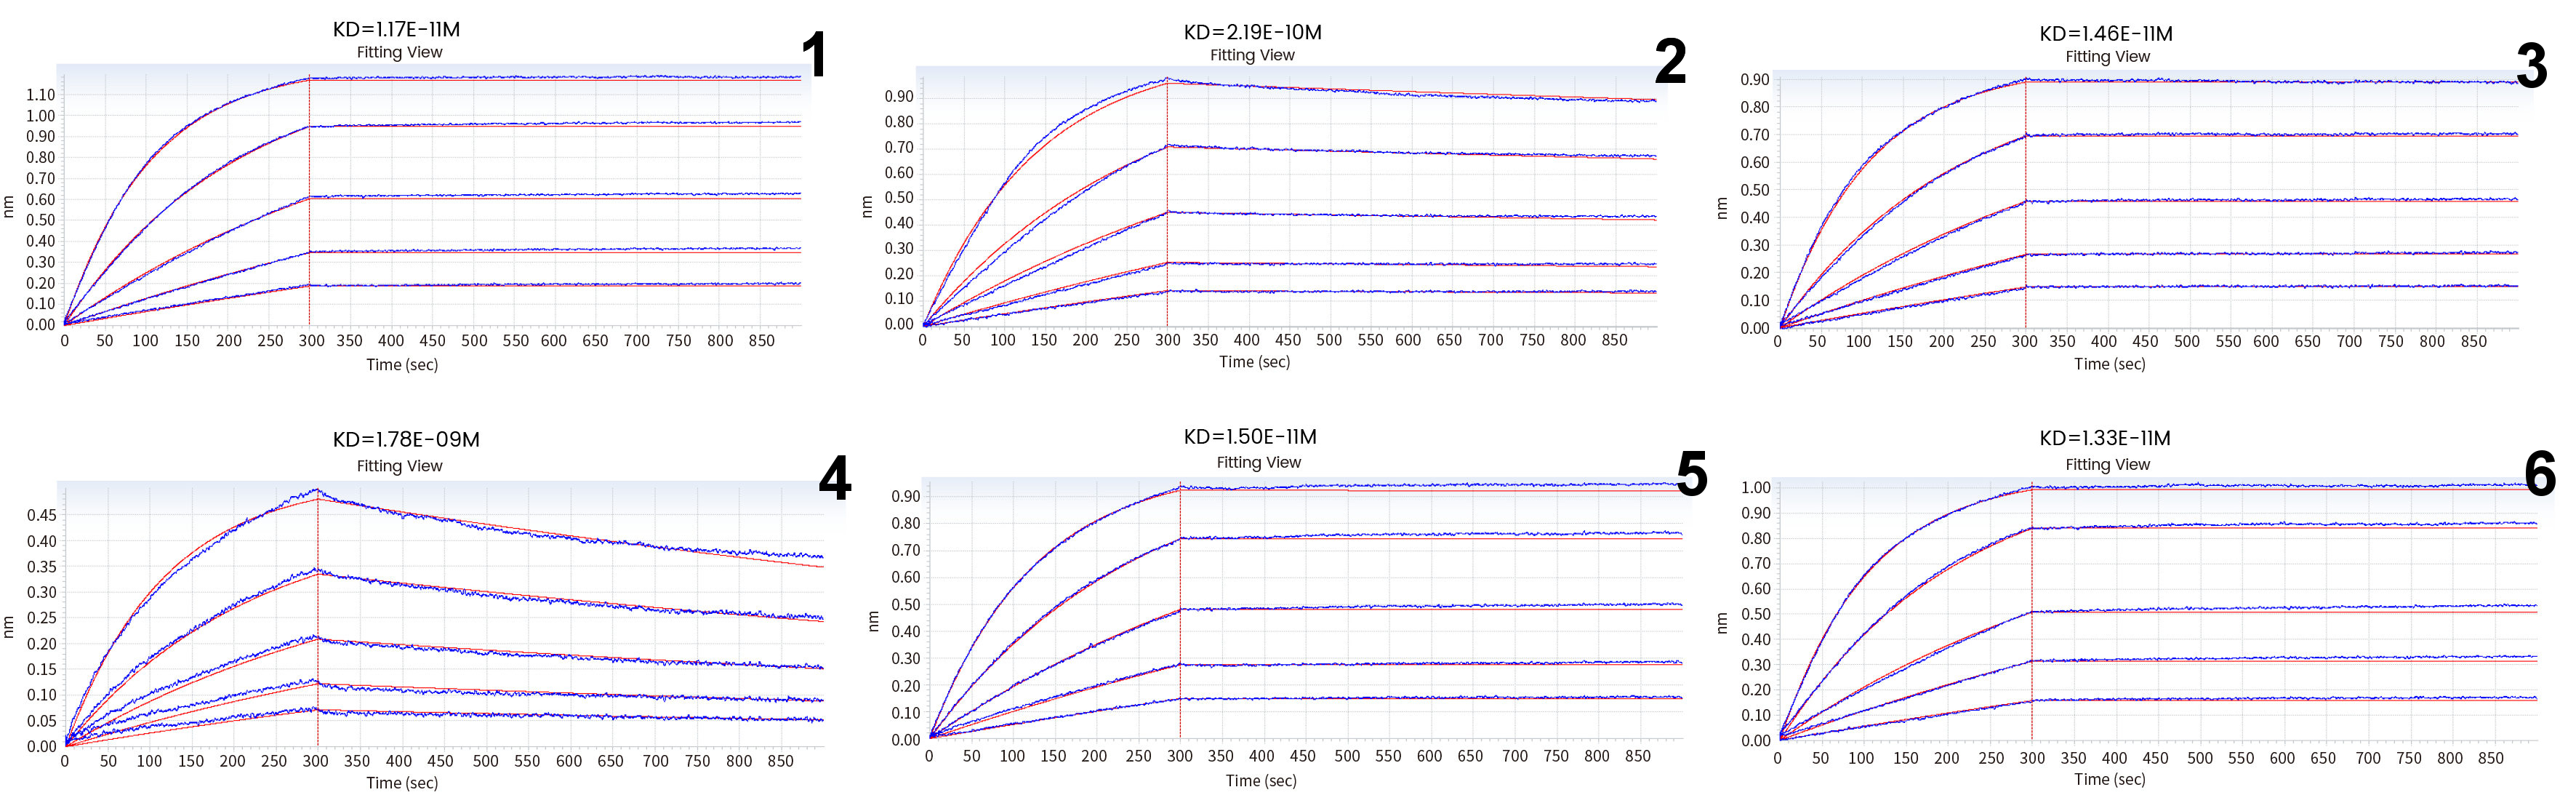
Figure 4 Kinetic screening of candidate molecules against the targets (Octet data)
III. Epitope analysis
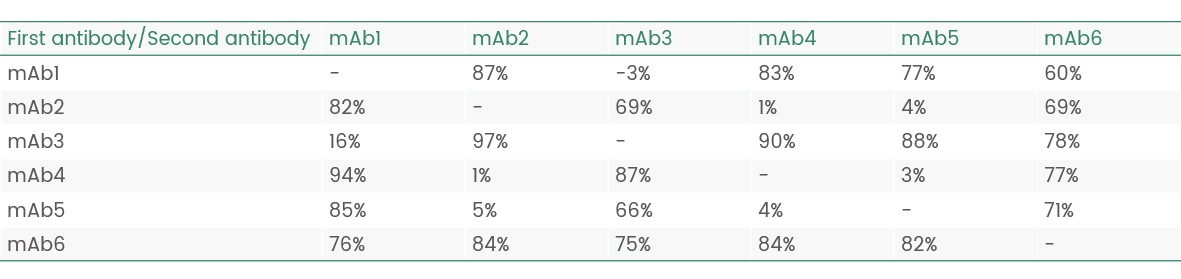
The antibody epitope mapping can be done with Biacore and Octet, as shown below.
Results of epitope analysis
Epitope Groups | Antibody No. |
Epitope I(possibly same/adjacent) | 114/182 |
Epitope II(possibly same/adjacent) | 141/206/623 |
Epitope III(possibly same/adjacent) | 40150-D002 |
Figure 5 Epitope analysis data (Biacore data)
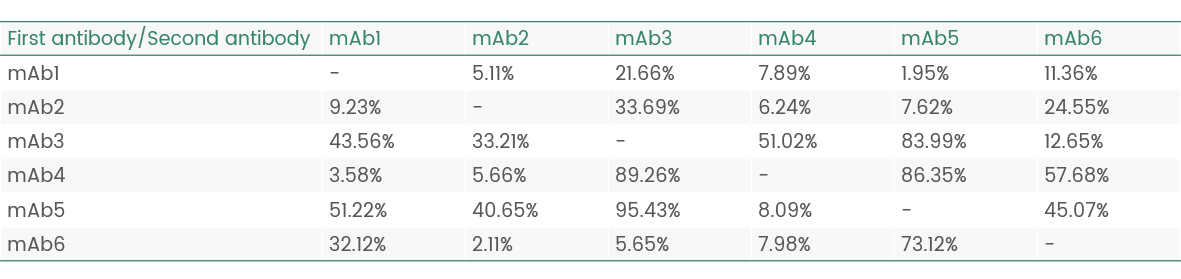
Results of epitope analysis
Epitope Groups | Antibody No. |
Epitope I(possibly same/adjacent) | mAb5 |
Epitope II(possibly same/adjacent) | mAb1/2/3/4/6 |
Figure 6 Epitope analysis data (Octet data)
IV. Comprehensive characterization of drug binding activity
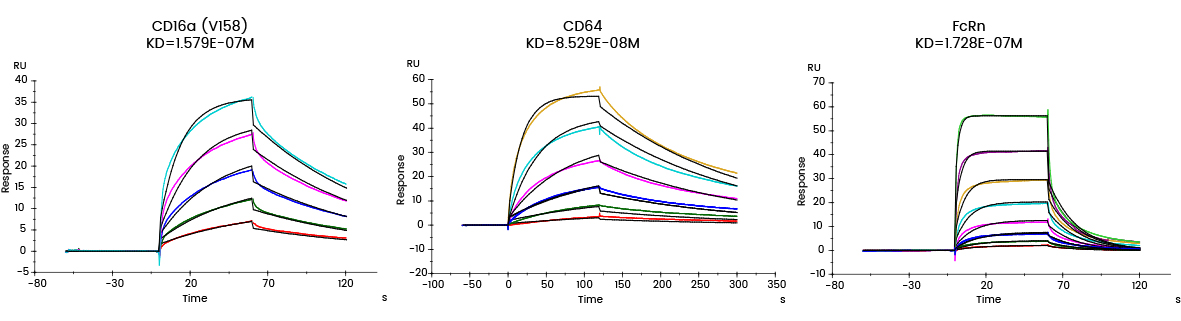
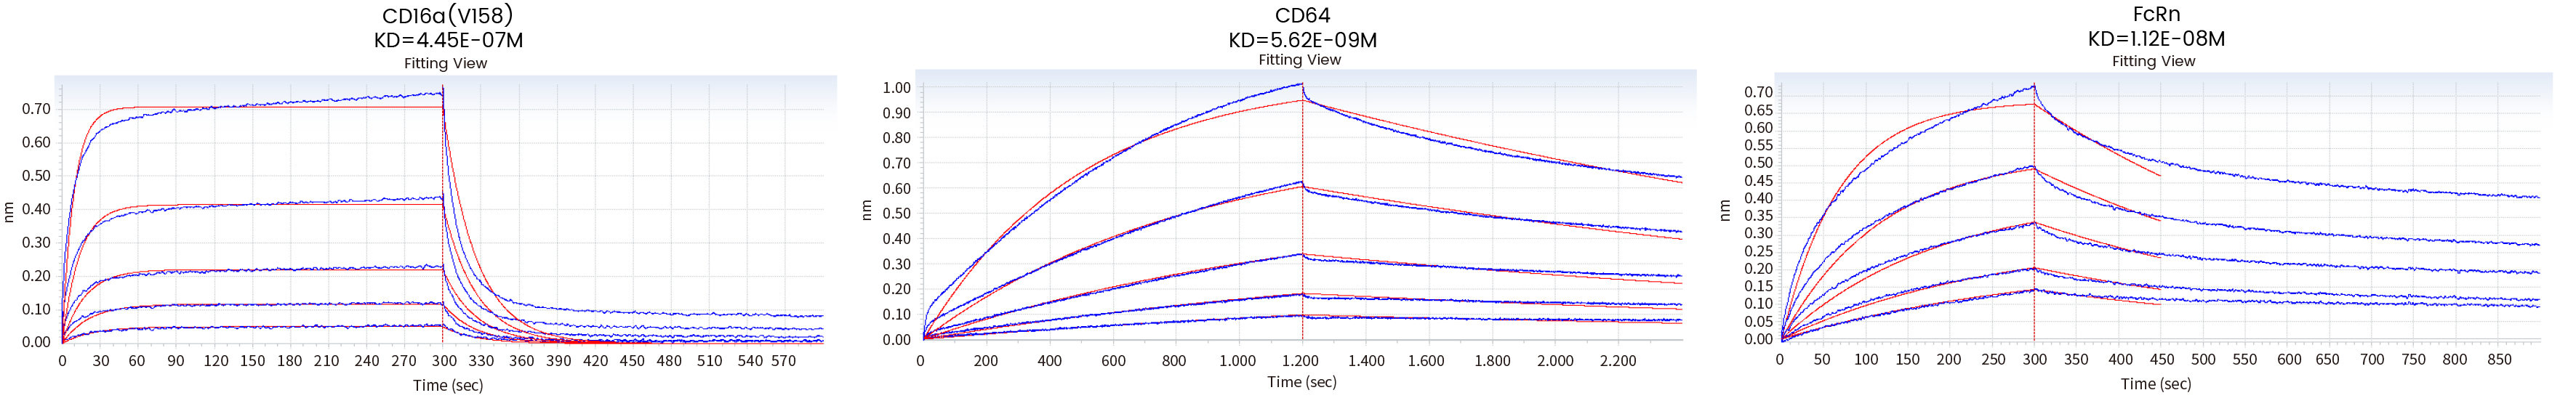
The affinity between the antibody and its target, and that between the antibody and the corresponding Fc receptors can be characterized using Biacore and/or Octet.
| Fc receptor protein
| Analyte | ka (1/Ms) | kd (1/s) | KD (M) | Rmax (RU) | Chi² (RU²) | U-value |
CD16a (V176) Cat: 10389-H27H1 | Ab1 | 7.349E+04 | 1.160E-02 | 1.579E-07 | 36.03 | 0.535 | 1 |
CD64 Cat: 10256-H08H | Ab1 | 6.051E+04 | 5.160E-03 | 8.529E-08 | 54.13 | 1.65 | 2 |
FcRn Cat: CT009-H08H | Ab1 | 3.206E+05 | 5.539E-02 | 1.728E-07 | 33.94 | 1.27 | 4 |
Figure 7. Affinity detection of target antibody drugs against Fc receptors (Biacore data)
Loading Sample ID | Sample ID | KD (M) | kon(1/Ms) | kdis(1/s) | Full R^2 |
CD16a(V176) Cat: 10389-H27H1 | Antibody | 4.45E-07 | 8.69E+04 | 3.87E-02 | 0.977 |
CD64 Cat: 10256-H08H | Antibody | 5.62E-09 | 6.28E+04 | 3.53E-04 | 0.996 |
FcRn Cat: CT009-H08H | Antibody | 1.12E-08 | 2.18E+05 | 2.44E-03 | 0.992 |
Figure 8 Affinity detection of target antibody drugs against Fc receptors (Octet data)
V. Consistency evaluation
The sensor map details can be compared and similarity scores can be given directly using Biacore's original fingerprint map comparison functions, eliminating errors caused by operations such as model fit selection.
The following case shows the analysis of the fingerprints of the generic drug Biosimilar and the original drug Drug D by using Biacore's consistency analysis software, then the results showed an 81.86% consistency.

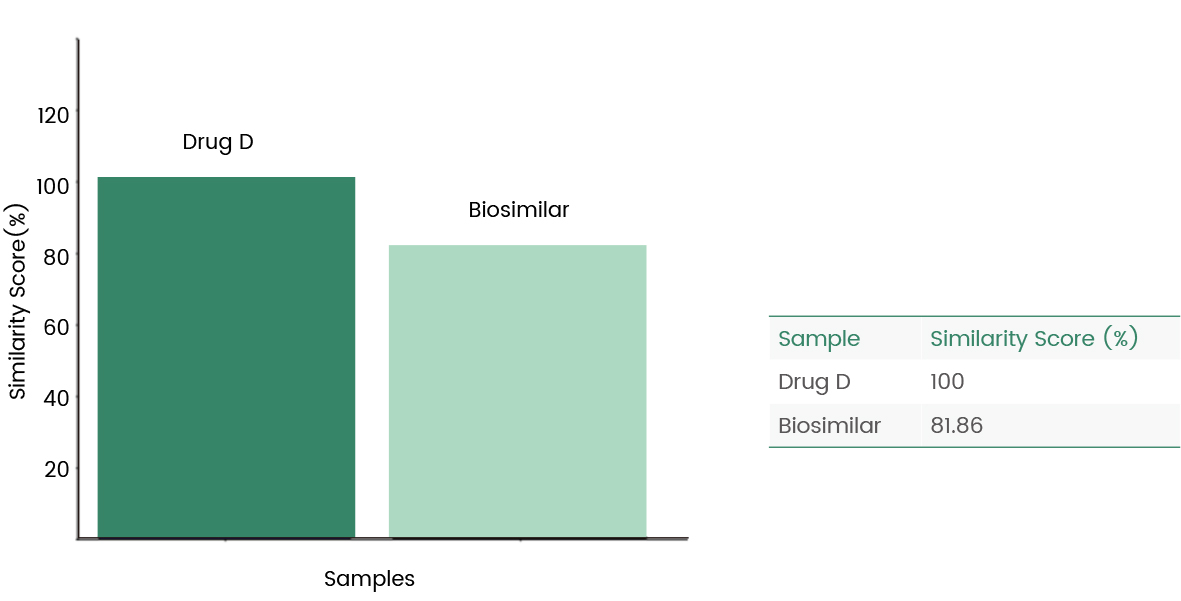
Figure 9 Biacore fingerprint comparison
VI. Biological activity quality control
Both SPR and BLI can be used for the batch release of final biotherapeutic products. The binding kinetics is an indicator of batch-to-batch consistency. It can also be used to determine the effective activity concentration of target proteins in the products.
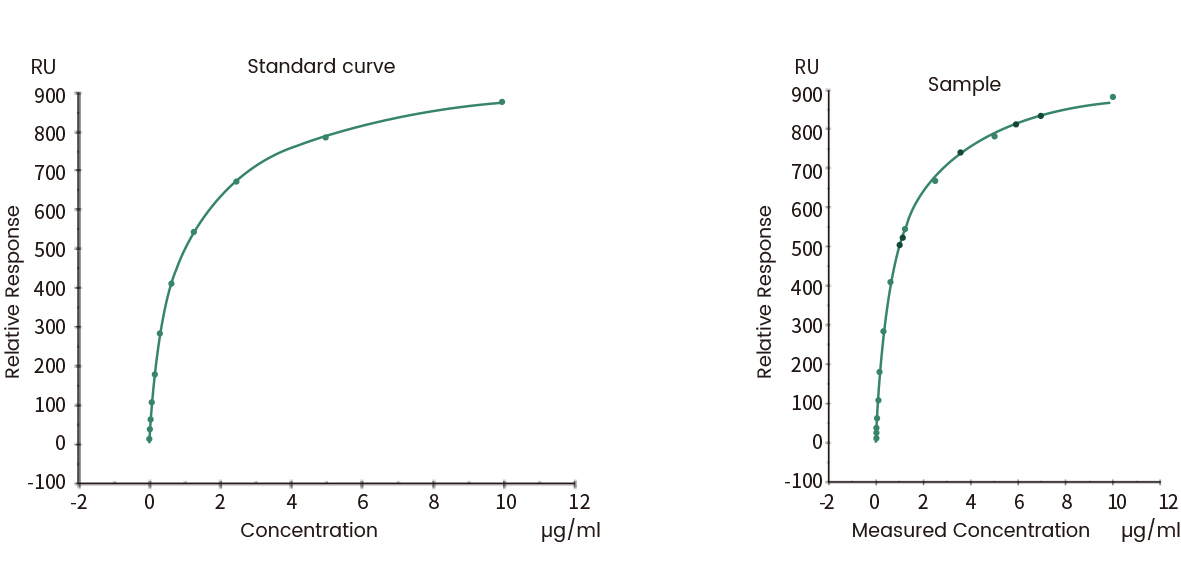
Figure 10 Concentration analysis (Biacore data)

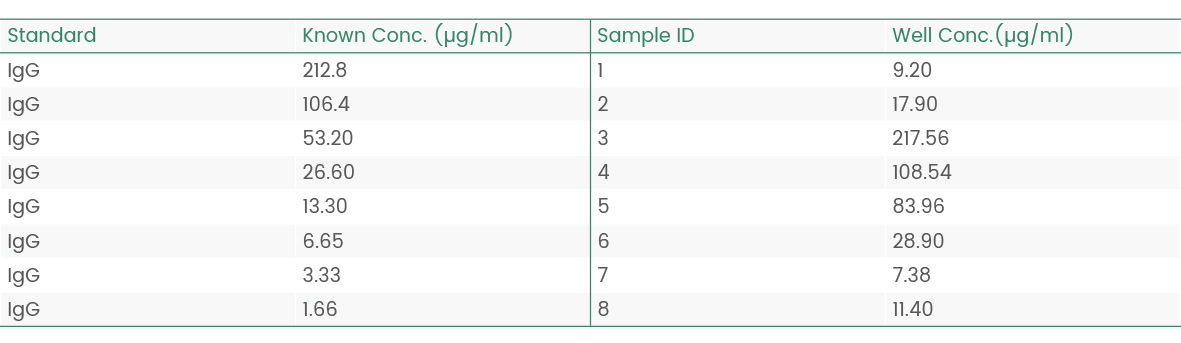
Figure 11 Concentration analysis (Octet data)
VII. Summary
SPR and BLI offer a variety of advantages over the traditional plate-based ELISA binding assays. Each method also has its own pros and cons. The users need to determine which method is better suitable for their specific experiment. Sino Biological offers affinity testing on both platforms. The company also provides associated products and services, including HTP antibody expression and target protein expression.
Comparison of BLI and SPR technologies
| BLI | SPR |
Advantages | Higher information for sample; More flexible operations; | Higher throughput; |
Disadvantages | Higher biosensors cost; Higher sample buffer restrictions | No thermodynamic parameters |
References:
- Doi:10.3791/55659
- Doi:10.1016/j.ab.2017.08.002
- Doi:10.3791/59687
- Doi:10.3390/v12060684